even in 1858 they knew to only use radial bar charts for seasonal comparisons, how did we get that so wrong in the last 150 years
NEW: Hudl Statsbomb Release Free Data for Five Top Women's Leagues
www.hudl.com/blog/statsbo...
i had the best time making these
silly little pelicans this weekend 🤩
i present: ✨The Pelifont✨
Ottawa native here: this is 1000% in line with my experience. What’s worse is that the overwhelming majority of speed cameras in Ottawa are set up in front of school zones, it’s not even like it’s policing major arteries where traffic is expected to be moving at 80km+ per hour
dftbaRachel 🦋
Hudl Statsbomb
Tan
Tan
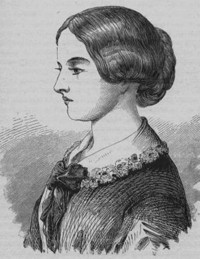
#TodayinHistory #dataviz #Onthisday #OTD 📊
🎂May 12, 1820 Florence Nightingale born in Florence, Italy 🇮🇹
Her 1858 radial diagrams used to inform & reform medical practice make her a graphic heroine
The City of Ottawa posted the raw speed data from before and after Doug Ford banned speed cameras and the effect is so obvious it's not even necessary put a line marking when that happened.
This chart shows the percentage of drivers going 15km/h or more over the posted limit.
Michael Friendly
It's Jamie
📊 Five #ggplot2 functions I wish I'd known about earlier 📊
I've written a short blog (with examples) of some of the lesser-known {ggplot2} functions and arguments that make it easier to create better charts!
Link: nrennie.rbind.io/blog/five-gg...
#RStats #DataViz
There are a few small tweaks you can make to your ggplot2 code to improve your charts. However, they’re not often mentioned. So here’s a few functions and arguments I wish I’d known about earlier.
{beekeeper} 0.5.0 is available on GitHub!
It currently generates documented #RStats functions for every endpoint described in an OpenAPI definition doc.
Watch for 0.6.0 in July! @returns documentation, example-driven testing, and hopefully response parsing (with {tibblify}).
beekeeper.api2r.org
Automatically generate R package skeletons from application programming interfaces (APIs) that follow the OpenAPI Specification (OAS). The skeletons implement best practices to streamline package deve...
Jon Harmon (he/him/his)
of the many entertaining things in this mexico/south africa match, my parents have been extremely amused by how some of these players are vigorously chewing gum, especially south africa's #20
apparently this is a Whole Thing because it made it into an april fool's joke over on the other site
if I wrote tanstack it would never have had these problems, how dare they besmirch my name like that