2022: design is dead!
2023: designers will all be replaced!
2024: you won't be replaced by an LLM, but by someone using the LLM!
2025: juniors will be replaced and AI will be surpervised by seniors!
2026 so far: It costs **HOW MUCH?!**
Alt: A cartoon of two sailors with shovels standing each at the side of a pile of money in front of a burning furnace. They are shovelling the money into the furnace with furious intent. An analogy to the current rage and money fueled haste of the tech industry to burn as much money as possible in the name of some sort of progress. I am not sure if the sailors know where the ship is going, but it doesn't matter, does it? What matters is to shovel as much money as possible into the furnace.
Common problem in Business Intelligence.
When a measure becomes the target, it ceases to be a good measure.
Because the focus goes in making the number move, regardless of consequences.
We leave this branch long when cutting back the Cherry tree as it is a favourite launching pad for Tūī accessing the feeder. One day it will probably break from the combined weight
T. from Data Rocks
This is really promising.
If you've ever looked for a map online that you could tweak, @willchase.bsky.social is building the vector map creator of your dreams (beta mode). 📊 🗺️
For me at least (a non-expert at GIS who needs quick maps), this fills an important gap.
graticule.org
T. from Data Rocks
Hey anyone got a go to #datavis reference I csn point someone at that covers how to show percentage point (aka basis point or base point) changes in a table?
It's Tree of the Year time Aotearoa! There are some beauties in the finalist list. Vote for rākau o te tau by the end of June. 🌳🌳
www.treeoftheyear.co.nz
The final #kakapo chick (Pearl-4B) from this year's cohort has fledged the nest (defined as roosting outside the nest for the first time). There are 91 chicks alive. They won't be counted towards the population until they're 150 days old. 📸 Petrus Hedman #conservation #kakapo2026 #parrots #birds
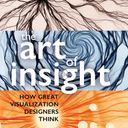
In the newsletter: "Twenty years of Hans Rosling's famous TED talk": openvisualizationacademy.beehiiv.com/p/twenty-yea...
#dataViz #infographics #DataVisualization #dataJournalism
Katya
The 2026 Rousseeuw Prize for Statistics has been awarded to the R Project. #RStats
www.rousseeuwprize.org/2026