🇫🇷🇩🇰 - Founder CEO @electricitymaps.com, using data & AI to build scalable solutions to Climate Change. Formerly @Snips @Google @IBMResearch
https://oliviercorradi.com
Olivier Corradi
Loading...
Electricity Maps is nine years old today! 🎂
Thank you to all our customers, partners, and community for all you do to help push data-driven decarbonization forward. ⚡️
Here's @corradio.bsky.social's first commit, from May 21, 2016: github.com/electricitym...
One of the coolest climate OSS projects, love the visualization. How green is your grid rn? ⚡️⚡️⚡️
Electricity Maps
Paull Young
New countries are popping up every day on @electricitymaps.com, as we've developed new models that extrapolate monthly and yearly data into hourly data, using load data, real-time weather data and much more.
Is there a country you'd like to see on our platform soon? Let us know!
New real-time data for ERCOT!
Check out our 72h view 🗺️! Perfect for tracking Europe's wind recovery.
While a dunkelflaute is rare, the data shows how quickly renewables bounce back. Here's how the German grid transformed:
Wind: 66.82% of demand
Carbon: 592→227 g/kWh
Price: €936→€13.96/MWh
Exports: 11.36GW
Hydro Storage: 2.78GW
@electricitymaps.com now shows 72hrs of data in the app. Very interesting to see how renewables eat away coal and gas in e.g. Texas.
Want to see a real-time map of the carbon intensity of electricity around the world? Electricity Maps has the goods!
🔌💡
Latest from the @electricitymaps.com blog: does the marginal power plant really exist?
Read more below 👇
www.electricitymaps.com/content/from...
New Historical Navigation feature in the app! 🎉
Explore hourly electricity data from the past month. Revisit milestones like Texas' renewable energy achievement at 12:00 PM on November 24th.
🔗 Check it out here: app.electricitymaps.com/zone/US-TEX-...
#greentech #energy
A major dunkelflaute hit Europe at 5pm yesterday: wind & solar generation dropped while energy prices hit €936/MWh in Denmark/Germany. A reminder of the need for load shifting, diverse energy sources and storage solutions for the winter months.
#EnergyMarkets #Renewables #Dunkelflaute #Germany
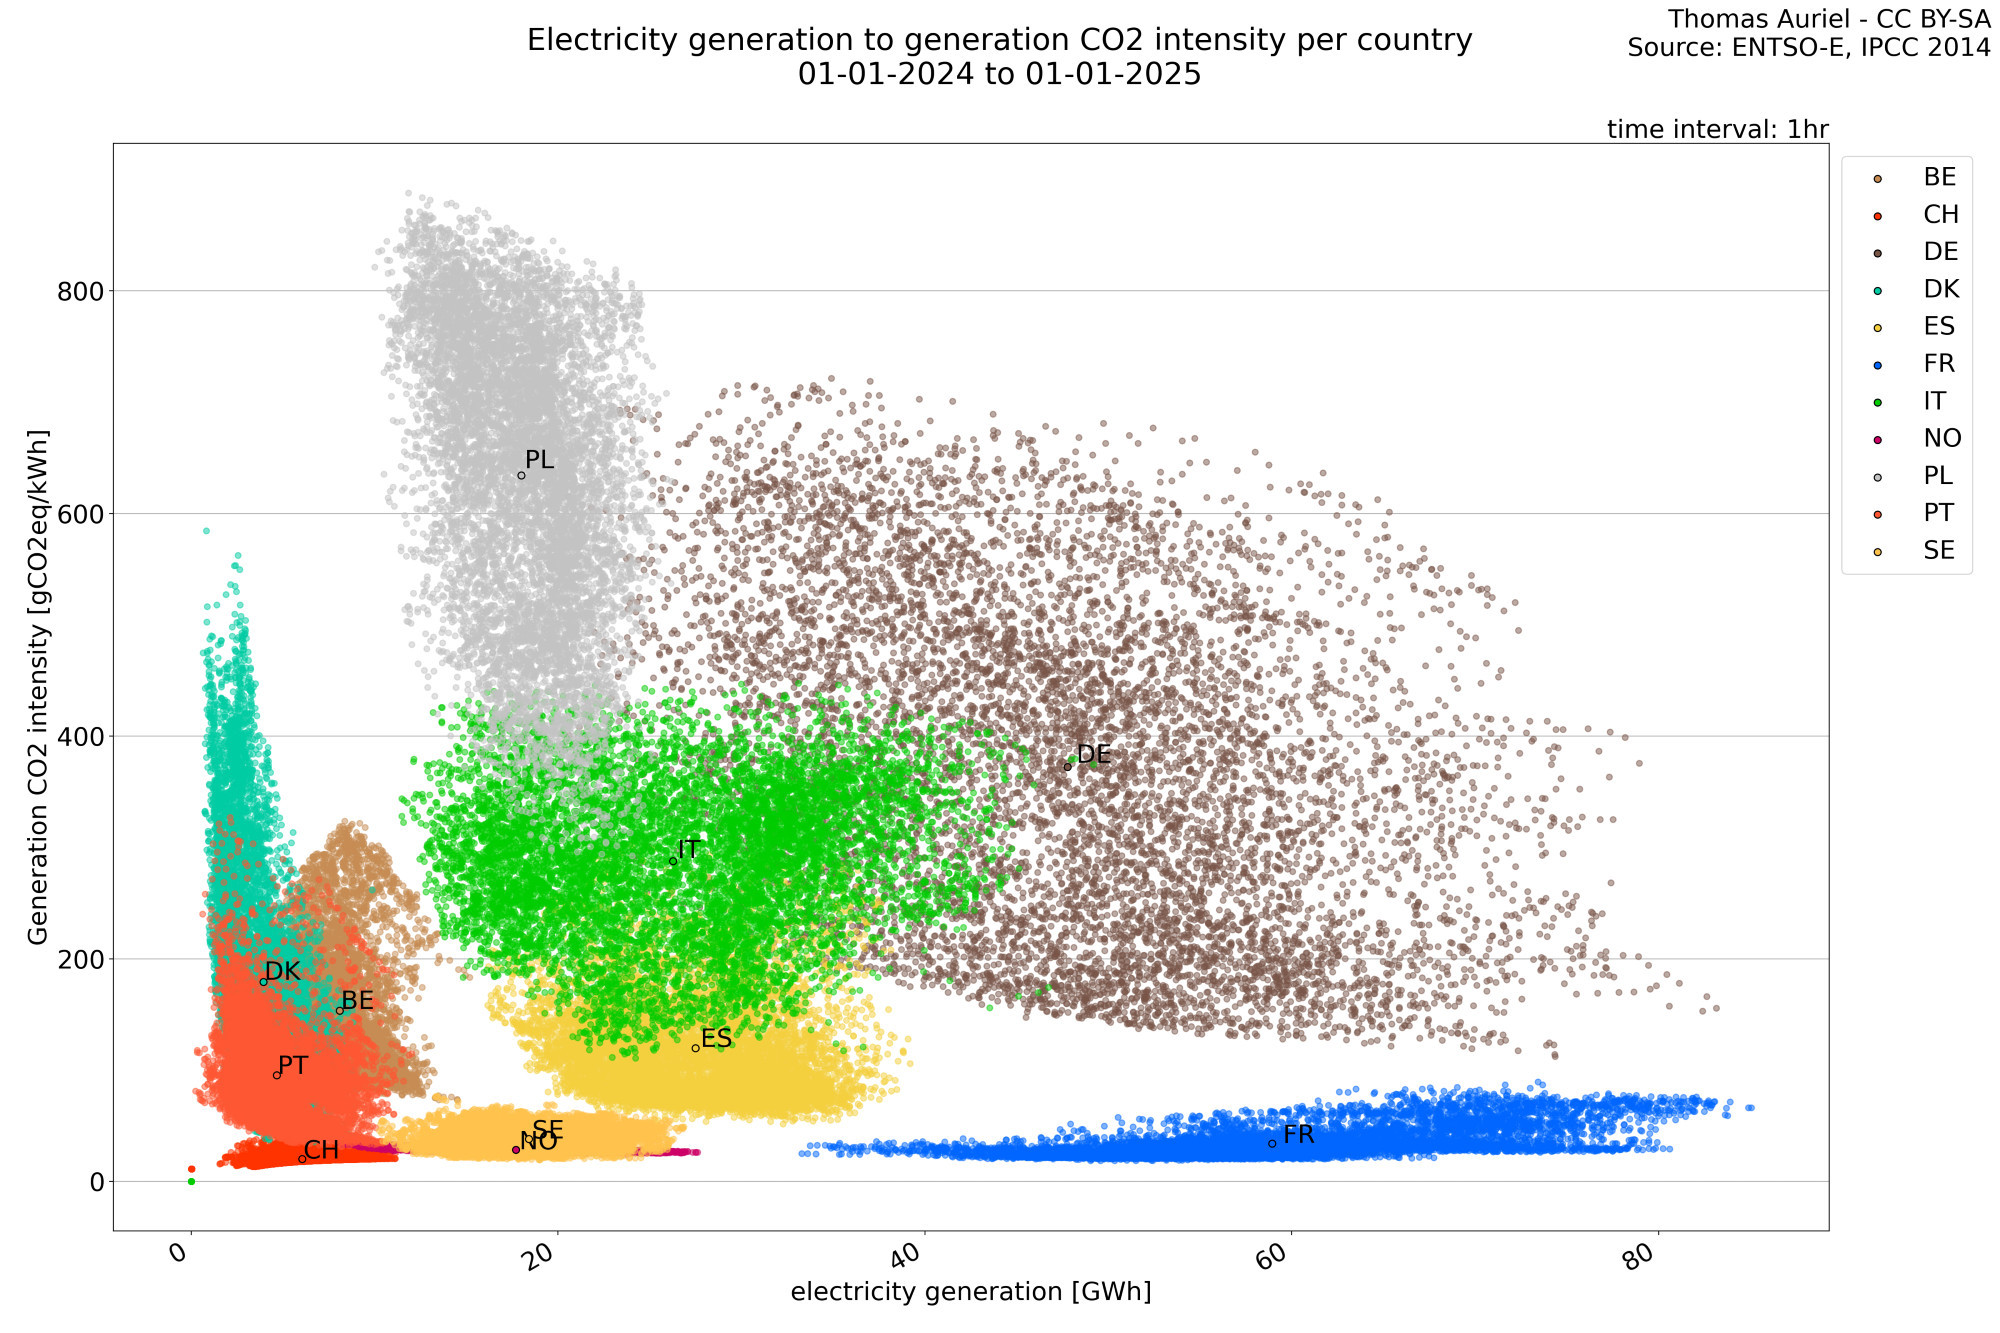
I'm please to announce that i published the now famous scatter graph : Comparison between the electricity generation and CO2 intensity per countries in Europe.
thomasprojects.net/BotElectrici...
Electricity Maps is a live 24/7 visualization of where your electricity comes from and how much CO2 was emitted to produce it.
app.electricitymaps.com
Indisputably, the marginal signal holds the theoretical power to represent emissions physically caused when more electricity is requested. However, this concept does not translate well to the reality ...
Milestone in Texas: At 12:00pm on the 24th of November ERCOT's grid hit 73.85% renewable power (45.23% wind + 28.62% solar), driving carbon intensity down to 127 gCO2eq/kWh!
Check out live data for ERCOT here: app.electricitymaps.com/zone/US-TEX-...
#renewables #electricity #texas